ArcGIS-Based Hail Risk Maps
VDE Events
Read more
Contact
Mr. John Sedgwick
News
Read more

VDE Americas' novel meteorological and economic hail risk maps empower project stakeholders to make informed risk management decisions.

Esri Marketplace
Esri

Esri's ArcGIS is the leading platform for mapping geospatial information. To support early-stage development activities—such as site selection, equipment specification, and insurance cost estimates—VDE Americas offers its best-in-class hail risk mapping data in ArcGIS via a software subscription model. Our mapping data allows ArcGIS users to map hail risk for the continental United States in meteorological or economic terms.

Schedule a demonstration

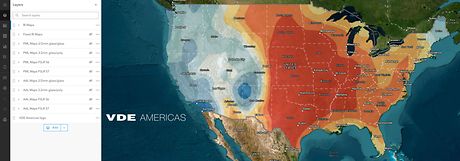
Naturally occurring hail return interval maps in ArcGIS Online

VDE Americas' hail return interval data covers the Continental United States (CONUS) and is available as an organization-level subscription. This set of data includes the return interval (RI) in years for naturally occurring hail (NOH) ranging in diameter from 25 mm (1 in.) to 95 mm (3.7 in.) and the maximum estimated hailstone diameter (dmax) for cumulative return intervals (e.g, 40 years or 100 years). The return interval metric characterizes the estimated amount of time between discrete events. Typical return interval periods for this data set include <25 years, 25–50 years, 50–100 years, 100–250 years, 250–500 years, 500–1,000 years, 1,000–5,000 years, and ≥5,000 years. Our meteorological model combines calibrated Next-Generation Radar (NEXRAD) data with observed hail records maintained by the NOAA Storm Prediction Center. The resulting geospatial hail risk data sets are visualized as contour maps.

Hail return interval data are especially useful for characterizing the maximum expected hailstone diameter over an asset's operational lifetime. For example, VDE Americas uses naturally occurring hail return interval data to inform engineered probable maximum loss (PML) and average annual loss (AAL) estimates for utility-scale solar farms. These same hail return interval data can also help insurers, risk advisors, technical advisory firms, and other service providers understand location-specific hail risk, which affects agriculture (crops and livestock), transportation (car dealerships), and the built environment (homes, businesses, and civic facilities) throughout the CONUS. 

RI Legend

Return interval data allow users to map hail risk according to hailstone diameter (25 mm–95mm) and event frequency (25 years–5,000 years). 

| VDE Americas

Solar project financial hail risk exposure maps in ArcGIS Online

VDE Americas uses naturally occurring hail return interval data to inform engineered probable maximum loss (PML) and average annual loss (AAL) estimates for utility-scale solar farms to inform site selection, product procurement, hail mitigation strategies, and insurance pricing and terms. Available via an organization-level subscription, this set of geospatial data quantifies financial risk exposure based on project location and fielded technologies, including PV module front glass thickness. Our financial risk exposure data includes 1-in-500 year probable maximum loss (PML), average annual loss (AAL), and extreme downside loss estimates across tracker tilt angles ranging from 0° to 75°, both facing into and out of the prevailing wind direction. These financial loss estimates account for differences in module hail resilience or vulnerability based on glass thickness (e.g., 3.2 mm vs. 2.0 mm vs. First Solar) and glass strengthening (e.g., fully tempered glass vs. heat-strengthened glass).

These financial loss exposure data serve a know-before-you-go purpose, informing equipment selection and insurance cost estimates during early-stage project development. According to insurance industry reports, hail accounts for less than 2% of solar project insurance claims by volume—but more than 50% of total dollar losses. Though some project locations will inevitably experience severe hail events, stakeholders can prevent or limit catastrophic hail damages with improved due diligence, technical literacy, and risk mitigation. These financial loss data empower project stakeholders to mitigate hail risk through physical defenses against damage avia appropriate equipment selection and operation.

Map Layers

Users can evaluate and compare financial risk exposure for all major PV module types and single-axis trackers.

| VDE Americas

VDE Americas' advisory services

Hail Risk Modeling and Mitigation

VDE Americas' provides solar project hail risk assessments based on site-specific meteorological data and product-specific technical details. Our science- and engineering-based hail risk reports provide solar project stakeholders with financial loss and risk exposure estimates based on project-specific lat-long coordinates and fielded PV module and tracker technologies.

Read more
Neighborhood Hail

Independent Engineering

VDE Americas specializes in providing transaction-level due diligence related to utility-scale solar photovoltaics (PV), battery energy storage systems (BESS), and hybrid solar-plus-storage applications. We also offer portfolio-level due diligence to support the deployment of commercial and industrial (C&I) distributed generation (DG) and community solar projects.

Read more
Engineer who works in the solar power plant and who checks something with his tablet

Owner's Engineering

VDE Americas work with investors and lenders to ensure the long-term success of a clean energy venture by reviewing and validating technical feasibility, regulatory compliance, and project execution. We do so by acting a concierge-style extension of our client's deal teams to provide on-demand critical engineering analysis, oversight, and support.

Read more
Ingenieur mit Schutzhelm, der mit Blaupausen auf einem Solarkraftwerk steht